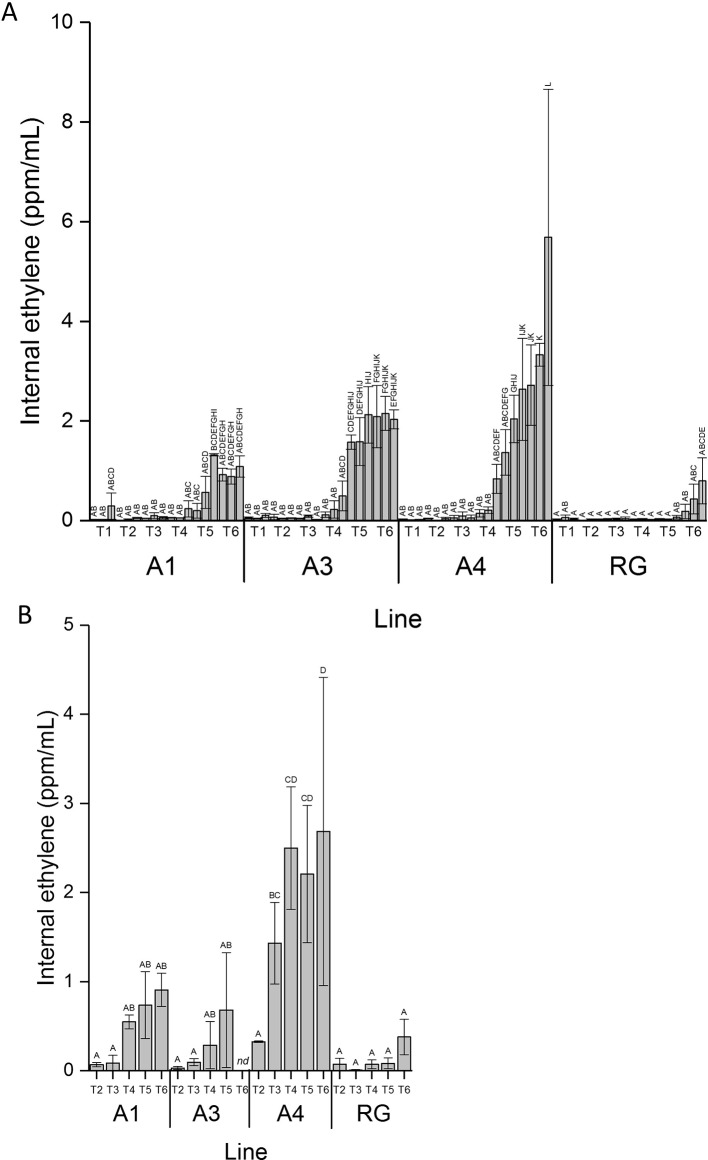
Figure 2.
Ethylene induction was earlier in anthocyanic fruit. (A) Internal ethylene concentration taken from the same fruit on the tree over fruit development for lines A1, A3, and A4 and WT control (RG). (B) Internal ethylene concentration taken from fruit harvested from the tree from time points T2 to T6. Mean of five biological replicates. T1, 35 DAFB; T2, 65DAFB; T3, 85 DAFB; T4, 110 DAFB; T5, 120 DAFB; T6, 130 DAFB. Error bars show ± SEM, different letters indicate statistical difference with P < 0.05.

