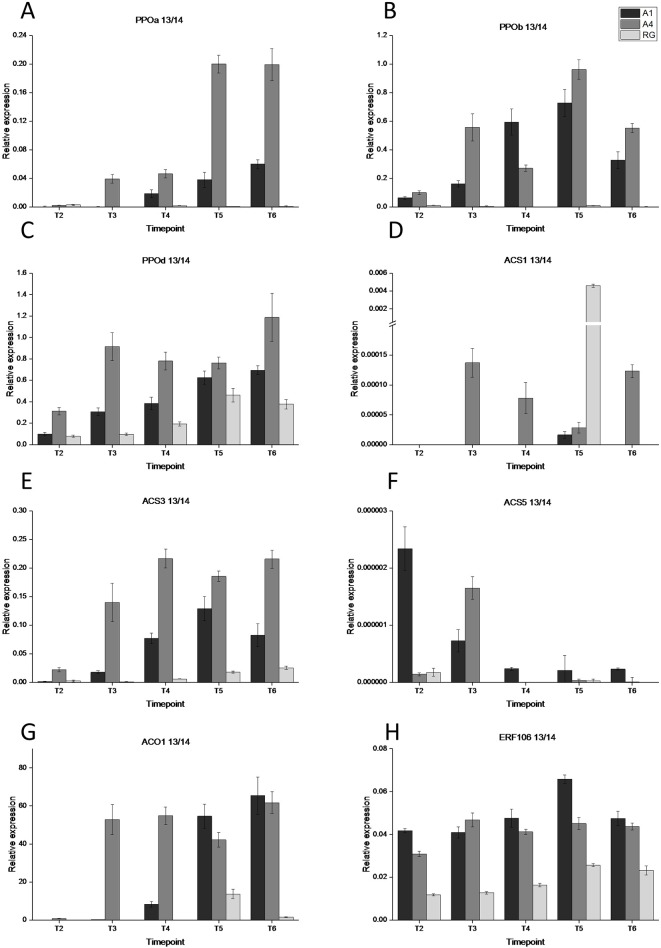
Figure 3.
Gene expression analysis of eight maturity and browning associated genes at five time points during fruit development during 2013-2014. (A) PPOa, (B) PPOb, (C) PPOd, (D) ACS1, (E) ACS3, (F) ACS5, (G) ACO1, and (H) ERF106. T1, 35 DAFB; T2, 65DAFB; T3, 85 DAFB; T4, 110 DAFB; T5, 120 DAFB; T6, 130 DAFB. Expression was normalised to EF1a and error bars are SE of four technical replicates of at least 5 pooled fruit per time point. Expression is shown for three lines; dark grey—A1, medium grey—A4, and light grey—RG.

