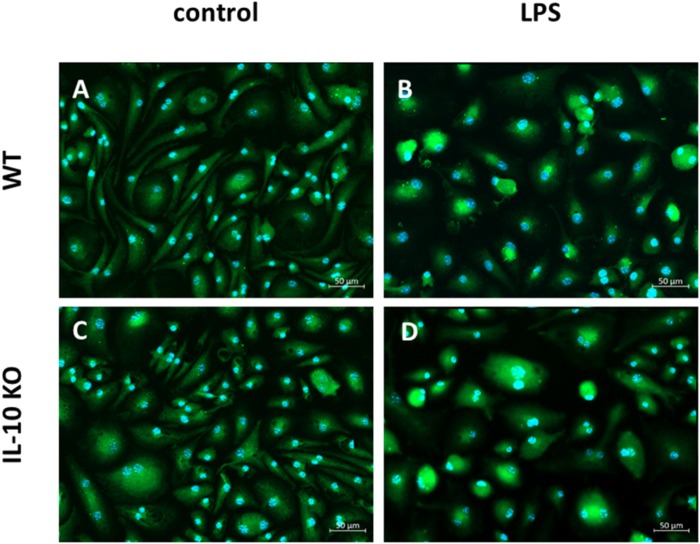
FIGURE 1.
Fluorescence microscopy of Iba1+ WT and IL-10 KO microglia. (A) WT (control), (B) WT (LPS); slim cell bodies, (C) IL-10 KO (control), (D) IL-10 KO (LPS), round, amoeboid cell shape. Representative figures of four independent experiments (n = 4); overlay Iba1/green, nuclei/blue, 200-fold magnification.

