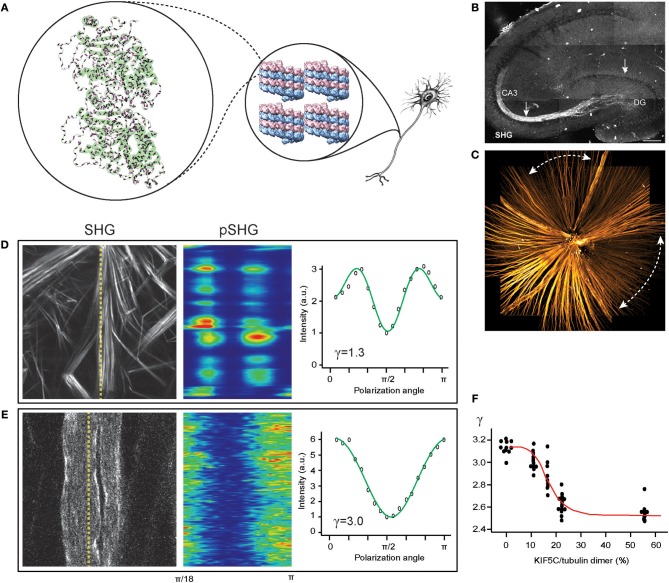
Figure 1.
SHG for imaging the central nervous system (CNS). (A) Tubulin heterodimer (PDB: 1TUB) with peptide bonds (magenta rods) in microtubule lattice (PDB: 5SYF), which are uniformly oriented in the axon. (B) The mossy fibers in an acute slice of the hippocampus imaged by SHG (reproduced from Dombeck et al., 2003). (C) The retinal nerve fiber bundles in the fresh wholemount retina of glaucoma-developing DBA mouse visualized by SHG. Dashed lines, characteristic sectorial degeneration of glaucoma (redrawn from Sharoukhov et al., 2018). (D,E) SHG intensity for collagen (D) and microtubules (E), respectively, and SHG polarization anisotropy (pSHG) corresponding to the dashed lines as a function of the polarization angle (redrawn from Sharoukhov and Lim, 2016). (F) SHG anisotropy of microtubule changes upon KIF5C binding. Red line, the best fit to the modified Hill equation (redrawn from Shima et al., 2018).

