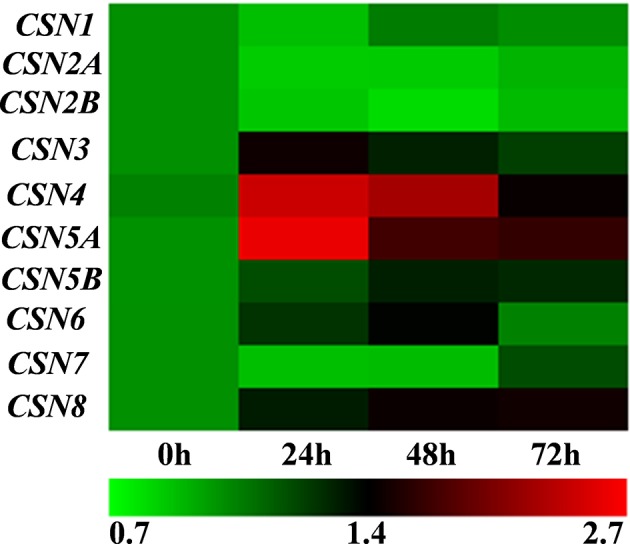
Figure 1.

Heat-map with the expression of COP9 signalosome (CSN) genes after root-knot nematode (RKN) infection in the roots of wild-type (WT) tomato plants. The labels 0 h, 24 h, 48 h, and 72 h indicate the time after RKN infection. Transcript levels were determined using quantitative real-time (qRT)-PCR, and cluster analysis was performed using MeV version 4.9. The color bar at the bottom shows the levels of expression. The data shown are the average of three biological replicates, and three independent experiments were performed with similar results.
