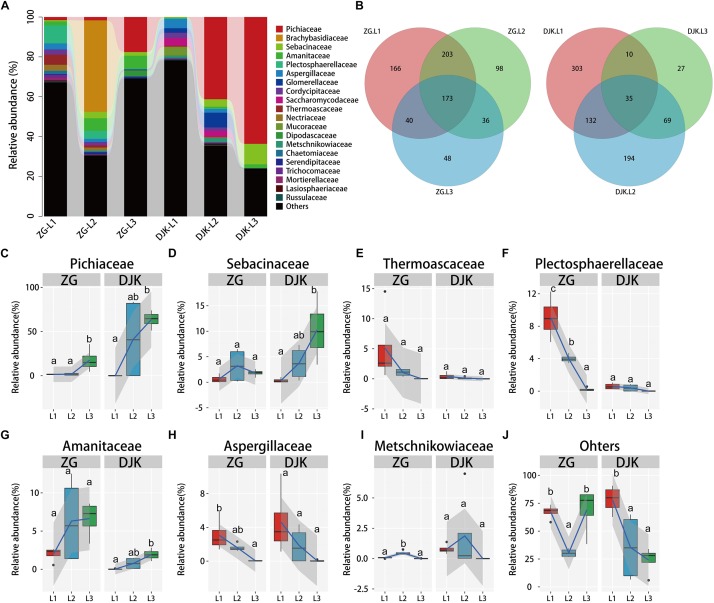
FIGURE 2.
Relative abundance of fungi across the lifespan of larvae. (A) Taxonomic breakdown at the family level grouped by different populations with different development stages. (B) Overlap of OTUs at the larval stage. (C–J) Boxplots showing the mean abundance of core fungi in the larval gut. In every panel, the left side represents the population collected from ZG (n = 4), and the right side represents the population collected from DJK (n = 4). The high, low, and median data values are shown in boxplots, and the lower and upper edges of every box represent the first and third quartiles, respectively. Multiple comparisons were performed in the two groups separately. Different letters indicate a significant difference between different instars in each group (p < 0.05, one-way ANOVA, Tukey post hoc test). The lines show median values per region window, and the shaded area denotes the estimated 95% confidence interval.

