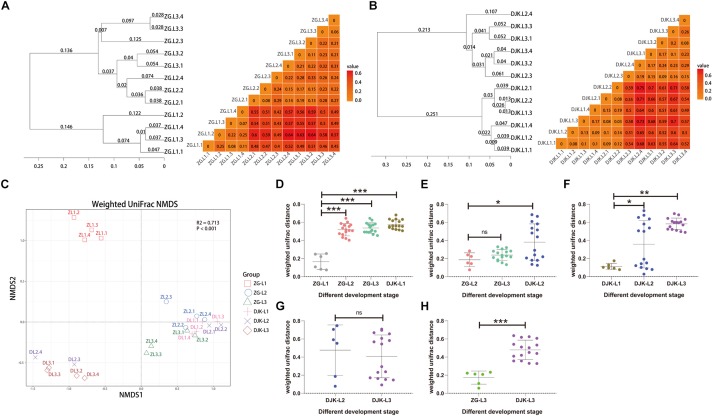
FIGURE 4.
Bacterial community dissimilarity of two field populations based on UniFrac metrics. (A) UPGMA (left) and heatmap (right) analyses of the bacterial community in the ZG population. (B) UPGMA (left) and heatmap (right) analyses of the bacterial community in the DJK population. (C) NMDS analyses of all samples. Each symbol represents a sample, and different colors represent the different development stages of larvae. Variation in communities segregated strongly according to host developmental stage and different field populations (PERMANOVA test with 999 permutations, P ≤ 0.001). (D–H) Weighted UniFrac distances between different development stages (n = 6∼16). In each panel, the first entry in the X axis serves as the reference for the comparisons, and the median is plotted as the horizontal line. ∗p < 0.05; ∗∗p < 0.01; and ∗∗∗p < 0.001; ns, not significant as calculated by Student’s t-test.

