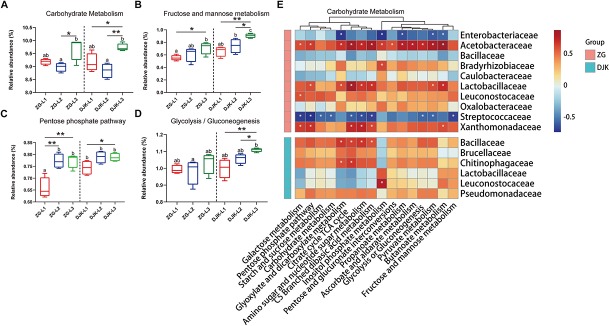
FIGURE 6.
Comparison of predicted KEGG pathways of larvae and Spearman correlation analysis. The inferred metabolic pathways are shown with carbohydrate metabolism (A), fructose and mannose metabolism (B), pentose phosphate pathway (C), and glycolysis/gluconeogenesis (D). Spearman correlation analysis between the carbohydrate metabolic pathways and bacteria (taxonomic breakdown at the family level) that vary significantly during the development of larvae is presented in heatmaps (E). Multiple comparisons were performed with one-way analysis of variance and Tukey’s post hoc test. Different letters indicate a significant difference between different samples (p < 0.05). ∗p < 0.05 and ∗∗p < 0.01, calculated by Student’s t-test. In heatmaps, blue represents negative correlation between gene expression and bacterial genus, and red represents a positive correlation, ∗P < 0.05.

