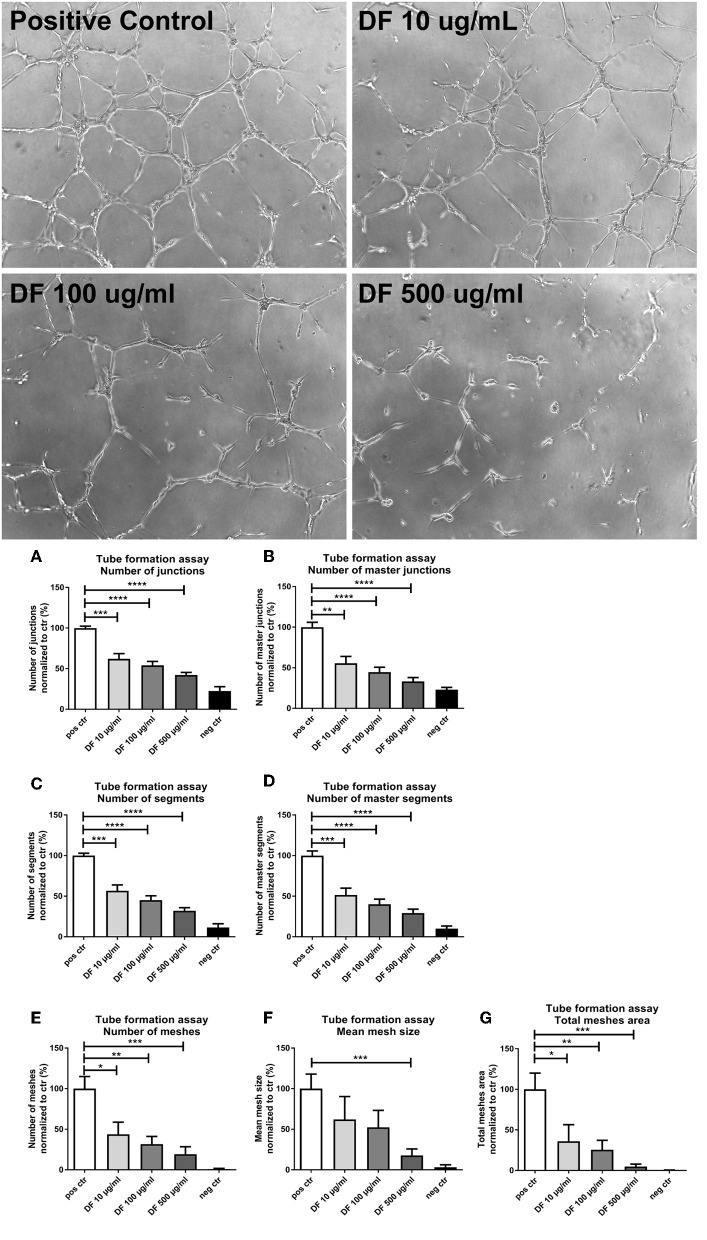
Figure 2.
Defibrotide (DF) suppresses endothelial cell (EC) tube formation. Representative images of angiogenic activity of ECs by a tube formation assay incubated with DF at different concentrations. Bar diagrams represent different characteristics measured during tube formation: numbers of (A) junctions and (B) master junctions, numbers of (C) segments and (D) master segments, and (E) number, (F) size, and (G) area of meshes, as indicated. Data are expressed as the mean ± SEM of three experiments. *P < 0.05, **P < 0.01, ***P < 0.001, ****P < 0.0001.

