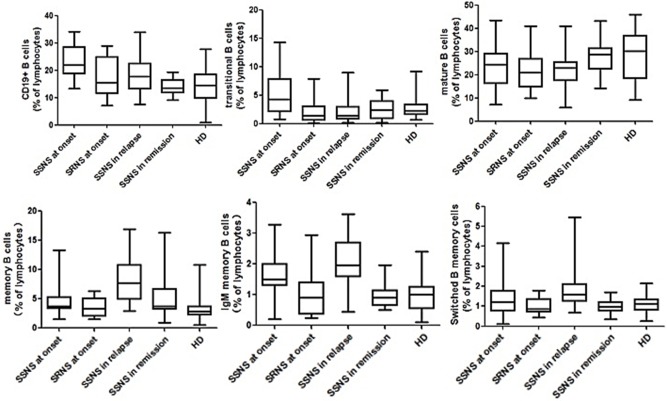
Figure 2.
Multicolor flow cytometry analysis is circulating B cell subsets in NS patients and controls. B cells cell subsets from patients at disease onset (n = 87, in which SSNS = 65, SRNS = 22), in relapse (n = 35), in remission (n = 32), and healthy controls (n = 75) were compared with each other. All of them were expressed as percentages of total lymphocytes. Each box plot represents the median and the 25th and 75th centiles.

