Figure 3.
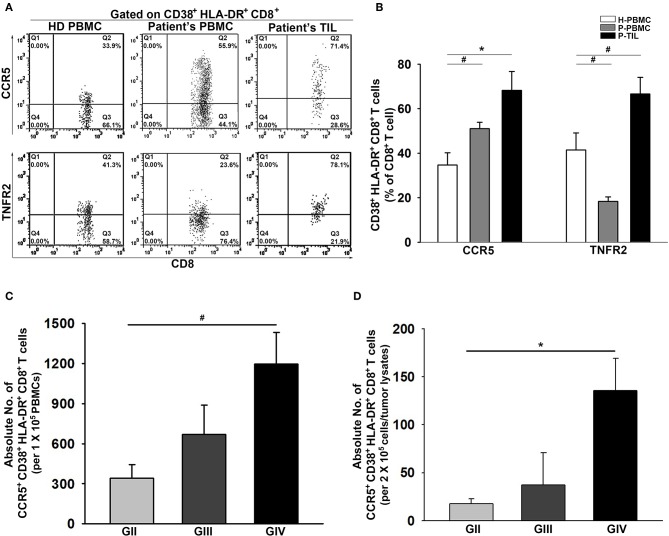
Increased activation of CCR5 and TNFR2 on CD38+HLA-DR+CD8+ TILs. (A) Representative images of percent expression of CCR5 and TNFR2 on CD38+HLA-DR+CD8+ T cells for HD PBMCs (n = 31), Patient PBMCs (n = 117), and Patient TILs (n = 17). (B) The percentage expression of CCR5 and TNFR2 on CD38+HLA-DR+CD8+ T cells were quantified. CCR5 and TNFR2 activation were inversely displayed on the patients' peripheral CD38+HLA-DR+CD8+ T cells; increased activation of CCR5 and TNFR2 on CD38+HLA-DR+CD8+ TILs. (C,D) Numbers of activated CCR5+CD38+HLA-DR+CD8+ T cells in the PBMCs and the gliomas of GII, GIII, and GIV were quantified. Values shown are means ± SEM (bars); *p < 0.05, #p < 0.01 by Student's t-test.

