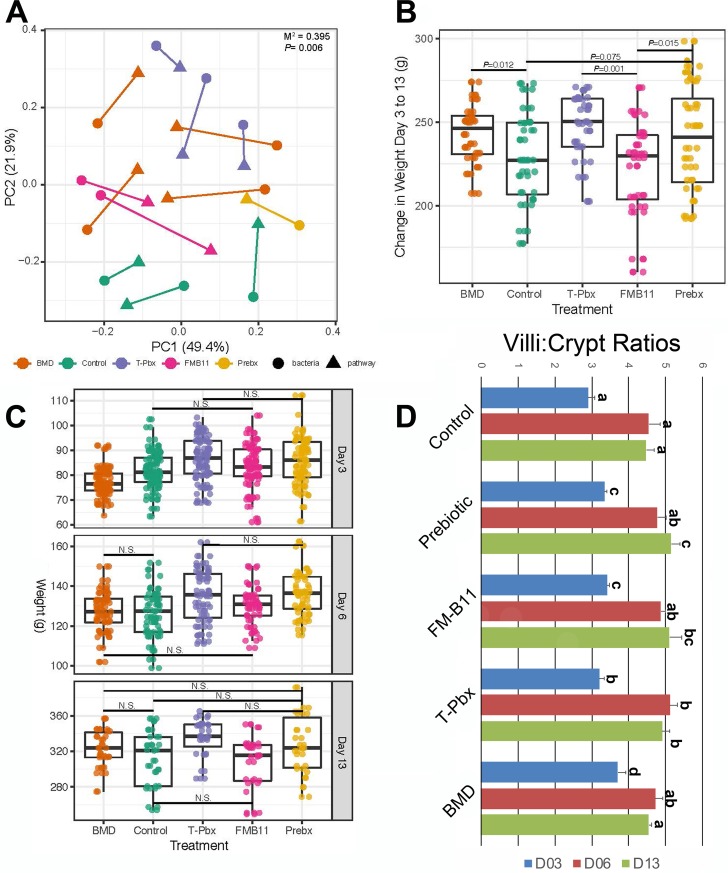
FIG 7.
Host phenotypes are correlated with microbiome shifts and treatment. (A) Procrustes analysis of principal coordinates from bacterial unweighted UniFrac distances and reactome pathway Euclidean distances. Samples are colored by treatment: control, antibiotic (BMD), turkey-tailored probiotic (T-Pbx), commercial probiotic (FM-B11), and prebiotic (Prebx). M2 and P values from n = 999 permutations are reported. (B) Change in total body weights from day 3 to day 13 for turkeys separated by treatment and tested via Student’s t test with P values reported. Numbers per treatment: control, n = 37; BMD, n = 38; T-Pbx, n = 36; FM-B11, n = 36; Prebx, n = 34. (C) Weights for each turkey on days 3, 6, and 13 of life, separated by treatment. Differences in weight by treatment were tested for by using a Student t test. N.S. represents P values of <0.05. (D) Villus height/crypt depth ratios averaged by treatment group in the ileum across treatment groups. Letters denote statistical significance (P < 0.05).

