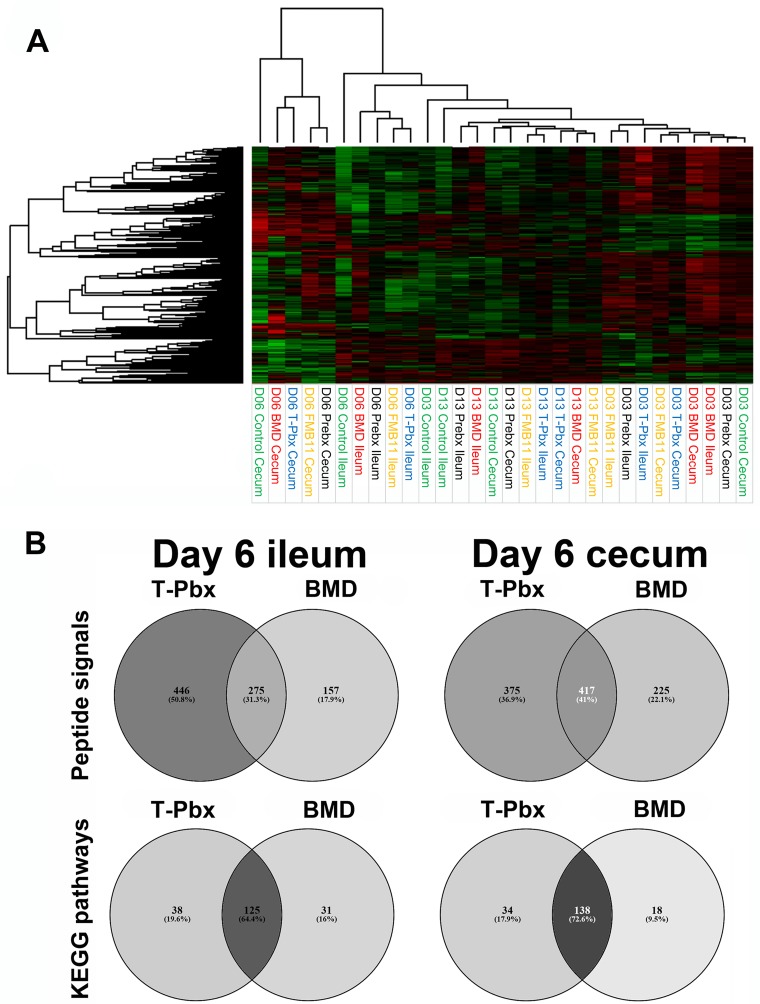
FIG 8.
(A) Peptide phosphorylation kinome profiles display clustering patterns by treatment, and turkey weight is loosely associated with treatment. Phosphorylation data for each peptide target site are presented, relative to control, on a heat map; red is increased phosphorylation, and green is decreased phosphorylation. Each condition is shown on the x axis. The connecting lines above the heat map show the relative similarity clustering of the different conditions described by the length of the lines. (B) Unique and shared effects of T-Pbx and BMD at the peptide signal (top) and KEGG pathway (bottom) levels, compared to their respective controls.

