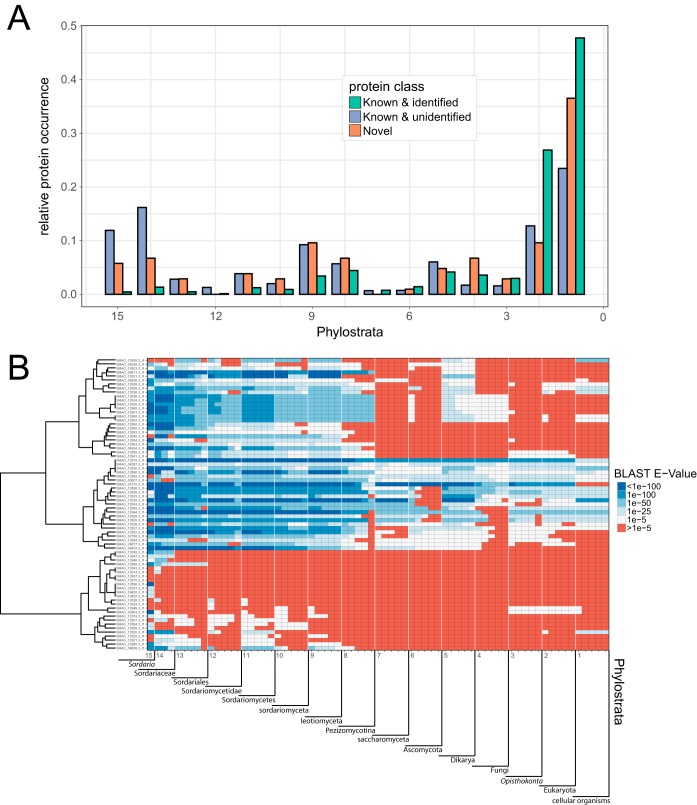
FIG 6.
Phylostratigraphic map of all S. macrospora proteins. (A) Division into known and identified detected proteins, novel proteins identified by the proteogenomics analysis, and known and unidentified proteins not found in this study. Relative protein occurrence (i.e., the number of proteins assigned to a PS relative to the total number of proteins) describes the share of proteins assigned to a given phylostratum (PS) within its aforementioned class. (B) Detailed phylostratigraphic map of all novel, completely annotated class I proteins, displaying the BLAST E value of the top 5 hits in every PS. Proteins are hierarchically clustered (Ward’s method) to show similarities in PS distribution.

