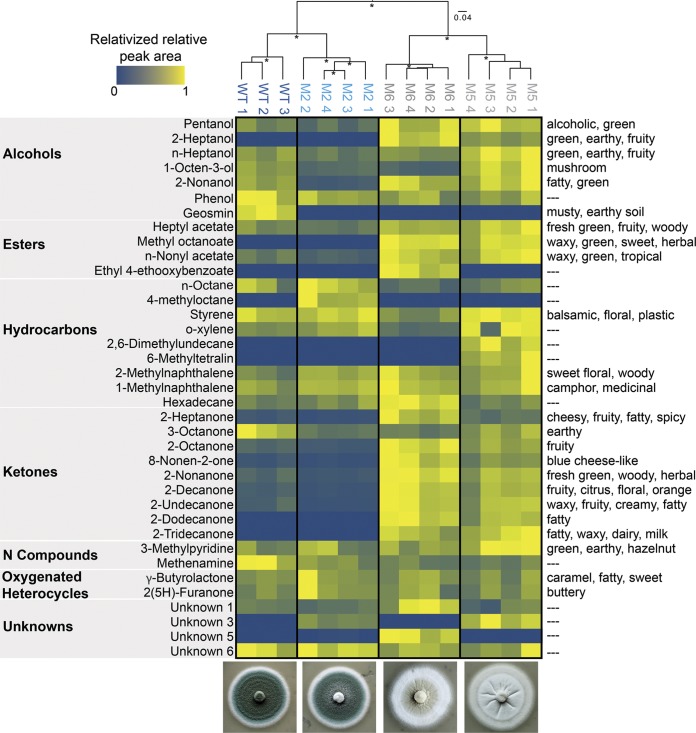
FIG 3.
Volatile organic compound (VOC) production of ancestral and domesticated Penicillium. Because total concentrations of VOCs are highly variable across different compounds, visualization was simplified by relativizing the relative peak areas from GC-MS chromatograms within each VOC to the highest concentration detected for that VOC. Only the VOCs that were detected across all replicates are shown. See Table S2 for all VOCs and their relative peak area values. The UPGMA tree is clustering the VOC profiles for each replicate based on Bray-Curtis dissimilarity. Asterisks indicate clusters with >70% bootstrap support. WT, ancestor phenotype. M2, M5, and M6 are all domesticated phenotypes. Numbers 1 to 4 after strain designations indicate biological replicates. Because of accidental sample loss during processing, only three biological replicates were collected from the WT. Descriptors on the right represent known aroma qualities of detected VOCs.

