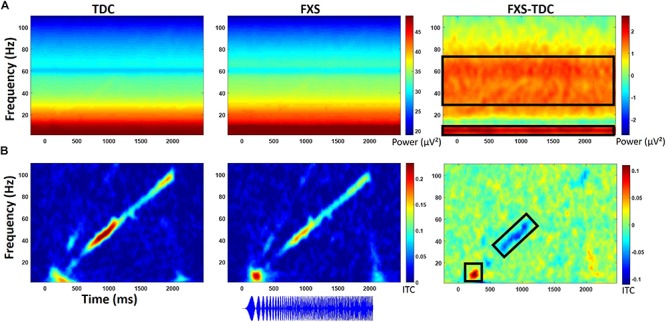
FIGURE 4.

(A) Single trial power (STP) for TDC, FXS, and difference maps (FXS minus TDC) for the chirp task. (B) Inter-trial coherence (ITC) for TDC, FXS, and difference maps (FXS minus TDC) for the chirp task. Black boxes in the difference maps indicate clusters with significant group differences. Warmer colors (reds, yellows) in the difference maps (right column) indicate higher phase-locking or higher power for FXS and cooler colors (blues, greens) indicate higher values for TDC. Chirp stimulus schematic is represented bottom center relative to x-axis timing.
