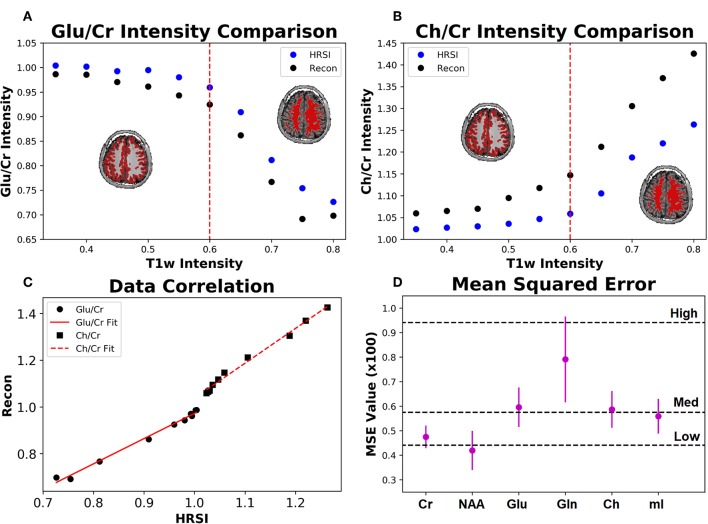
Figure 10.
The Glu/Cr (A) and Ch/Cr (B) signals averaged over ten subjects are shown for the experimentally acquired images (HRSI) and the images reconstructed from low resolution 32x32 images (Recon). The signals are shown as a function of the T1w intensity, which is representative of the gray and white matter content of the voxel. The red dotted line represents the point at which the gray matter content equals the white matter content in a voxel. The correlation between the HRSI and Recon values are plotted (C) with linear fits. For both Glu/Cr and Ch/Cr, the r2 values of the fits are above 0.99. Finally, the mean squared error for the ten subjects calculated between the HRSI and Recon for each metabolite map (D) is displayed. The dotted black lines reflect the MSE from the testing set for different noise values (low, medium, and high).

