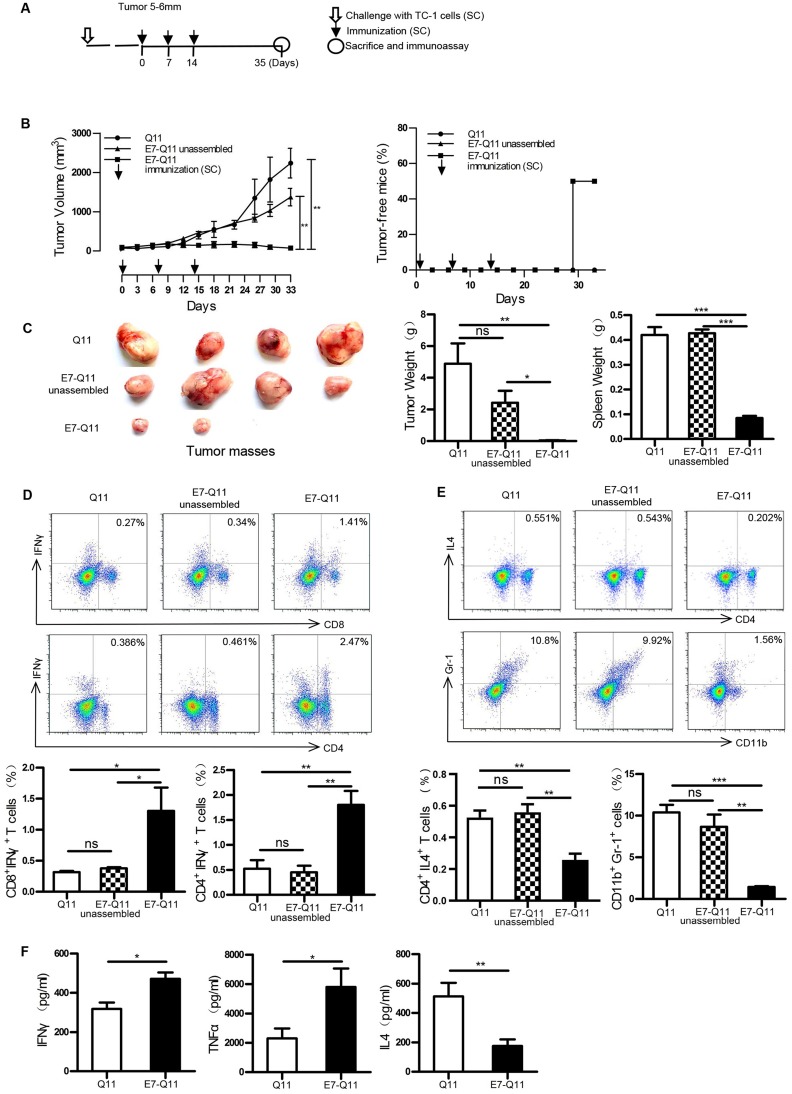
Figure 4.
Therapeutic immunization with nanofibers significantly suppressed the growth of established TC-1 tumors with a diameter of 5–6 mm.
Notes: (A) The experimental protocol. (B) Left: The tumor volumes were monitored every 3 days. Right: The percentage of tumor-free mice was calculated on the indicated days. The differences were determined using one-way analysis of variance (ANOVA) followed by Tukey’s multiple comparisons test. **P < 0.01; n = 6. (C) Left: representative pictures of tumor masses; Middle: weight of isolated tumor masses; Right: spleen weight. *P < 0.05; **p < 0.01; ***P < 0.001; n = 4. (D) Above: representative flow cytometry plots of Th1 and CTL cells; Below: statistical data. *p < 0.05; **p < 0.01; ns: p ≥ 0.05; n = 4. (E) Above: representative flow cytometry plots of Th2 and MDSC cells; Below: statistical data. *p < 0.05, **p < 0.01; ***p < 0.001; ns: p ≥ 0.05; n = 4. (F) The contents of IFN-γ, TNF-α, and IL-4 in the supernatants of E744-62 -stimulated splenocytes by ELISA. The differences were determined using unpaired Student’s t-test. *p < 0.05; ** p< 0.01; n = 4.
Abbreviations: s.c., subcutaneous; IFN-γ, interferon-γ; IL4, interleukin 4; MDSC, Myeloid-derived suppressor cell; TNF-α, tumor necrosis factor α; ELISA, the enzyme-linked immunosorbent assay.

