
Figure 1.
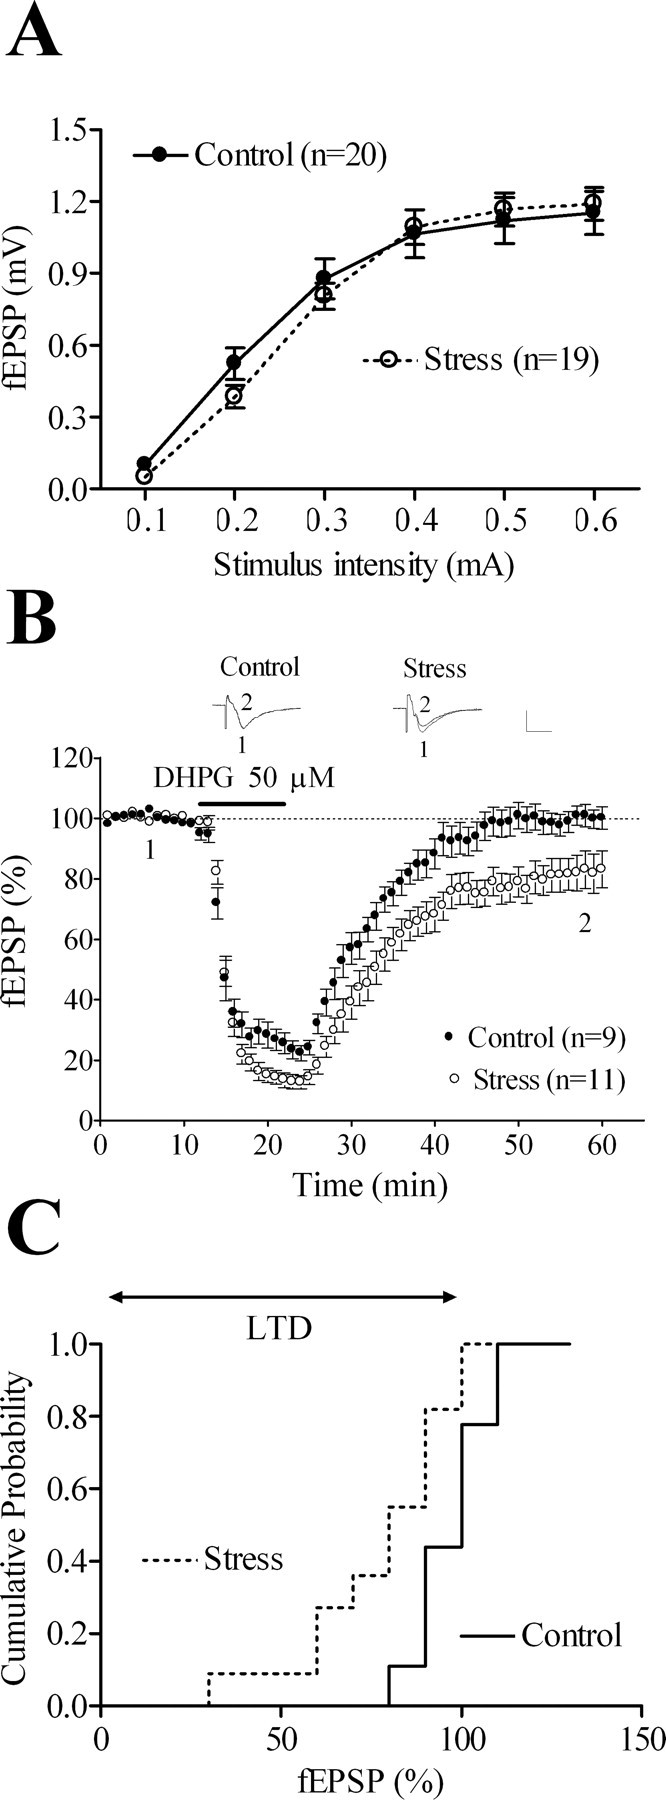
Acute stress facilitates mGluR-LTD in the rat hippocampal CA1 region. A, fEPSP responses to increasing stimulus intensities do not differ between slices from control and stressed rats. B, A 10 min application of 50 μm DHPG elicits LTD in slices from stressed but not from control rats. Whether analyzed during the last 10 or 20 min of recordings, stress, but not the stress × time interaction, proves significant (F(1,162) = 7.64, p = 0.013 and F(1,342) = 9.05, p = 0.008, respectively). Inset, Representative fEPSPs taken at the time indicated on the graph below. Calibration: 0.5 mV, 10 ms. C, Cumulative probability distribution of the normalized fEPSPs represented as averages in B. In this and subsequent figures, each point is the average of two successive responses, and dashed lines represent 100% of baseline. Data are represented as mean ± SEM.