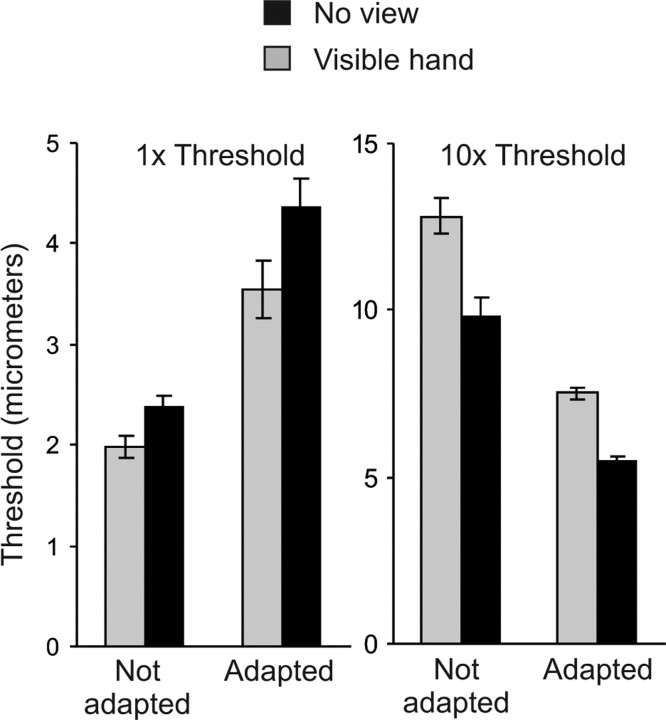
Figure 3.
Discrimination thresholds in experiment 5. Subjects discriminated between low-amplitude vibrations (base amplitude = 1× detection threshold) and between higher-amplitude vibrations (base amplitude = 10× detection threshold). Vertical bars show within-subject SEM (see Fig. 2 for description).

