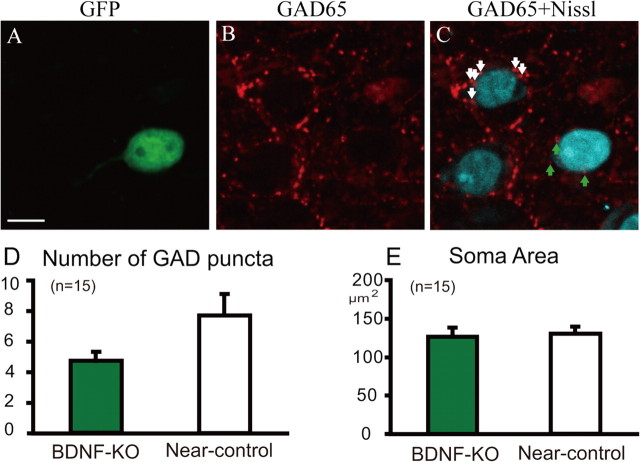
Figure 5.
Reduction of GABAergic presynaptic terminals around the soma of BDNF-KO neurons. A, Fluorescent image of a GFP-expressing neuron (green). Scale bar: (in A), A–C, 10 μm. B, Fluorescent image of GAD65-positive presynaptic pucnta (red). C, Superposed image of A and B. Green and white arrows indicate GAD65-positve puncta around the soma of BDNF-KO and neighboring control neurons, respectively. D, Mean numbers of GAD65-positive puncta around soma of BDNF-KO and neighboring control neurons. Error bars indicate SEM. E, Mean area of soma of the BDNF-KO and neighboring control neurons.

