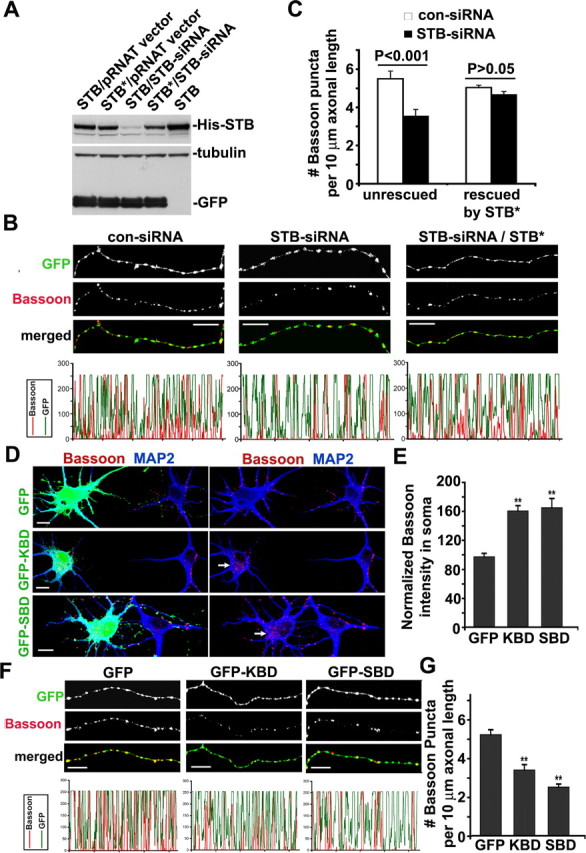
Figure 3.

Knockdown of syntabulin or expression of its dominant-negative transgenes reduces the density of Bassoon clusters within axons. A, Syntabulin knockdown is rescued by the RNAi-resistant mutant of syntabulin (STB*). COS7 cells were cotransfected with siRNA constructs with cDNAs expressing His-STB or His-STB*. The expression of syntabulin was determined by immunoblotting of cell lysates prepared 4 d after transfection. To monitor transfection efficiency and equal protein loading (15 μg), GFP and β-tubulin were immunoblotted after stripping the same blot. B, Representative axonal images of hippocampal neurons transfected at DIV3 with con-siRNA or STB-siRNA, or cotransfected with siRNA constructs and HA-STB*, followed by immunostaining for Bassoon and MAP2. A cGFP was encoded in the siRNA vector to visualize the morphology of transfected neurons. MAP2-negative axonal segments are shown in grayscale for individual channels and in color for merged channels. The corresponding profiles reflect the relative distribution (density) of Bassoon clusters (red) along GFP-filled axonal processes. C, Relative density of Bassoon puncta per 10 μm axonal length. Total axon length measured was 3541.82 μm (con-siRNA), 4007.47 μm (STB-siRNA), 5994.11 μm (con-siRNA and HA-STB*), and 4384.79 μm (STB-siRNA and HA-STB*). D–G, Hippocampal neurons were transfected at DIV5 with GFP-KBD, GFP-SBD, or GFP alone, followed by immunostaining at DIV7 for Bassoon (red) and MAP2 (blue). D, Representative images of the cell body for each transfection condition. The arrows point to Bassoon accumulated within the somata of transfected neurons. E, The relative mean intensity of Bassoon in the somata, normalized by that of untransfected cells in the same image. F, Representative MAP2-negative axonal images shown in grayscale for individual channels and in color for merged channels. G, Reduced density of Bassoon puncta within the axons of developing neurons expressing either GFP-KBD or GFP-SBD. Total axon length measured was 4037.98 μm (GFP-KBD), 4323.81 μm (GFP-SBD), or 4169.57 μm (GFP). The data were collected from 15 neurons cultured on three different coverslips for each construct. Error bars indicate SEM (**p < 0.001). Scale bars, 10 μm.
