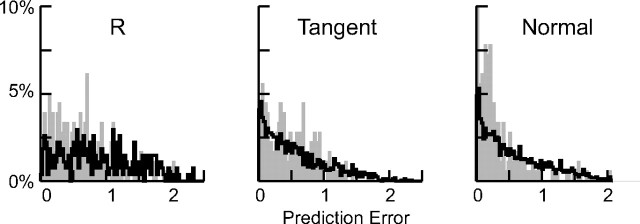
Figure 12.
The distribution of extrapolation errors at the time interception was initiated for one subject (1). The gray shading shows the results of the subject's performance, and the thick black trace shows the results had the onset of interception been randomly distributed. The first column shows the overall size of the error (r = x × y); the next two columns show the size of the error in the direction tangent from a line drawn from the target to the finger and in the direction normal to this line. Of the five subjects, the data show the largest deviation from randomness.

