
Figure 4.
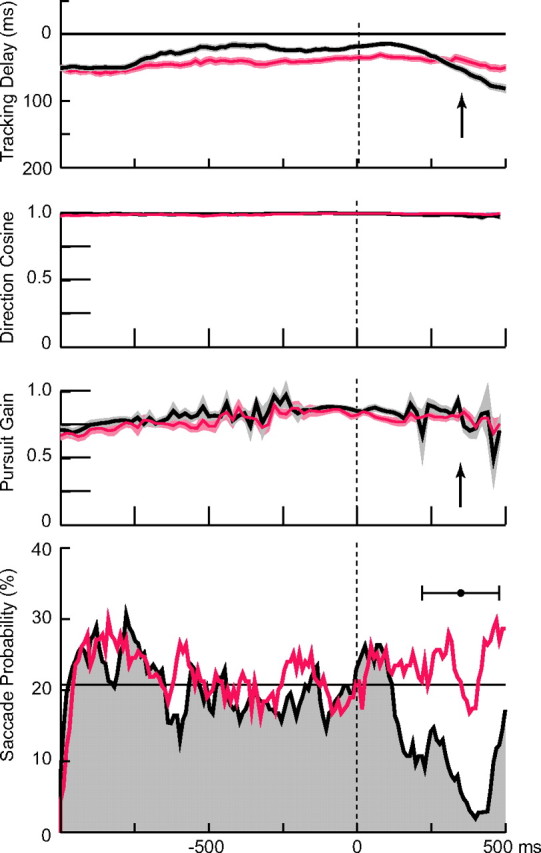
Variations in saccade probability and pursuit gain during target interception. The black traces (from top to bottom) show (1) the time delay between target and gaze position; (2) the direction cosine, defined as the cosine of the angle between direction of pursuit and the direction of target velocity; (3) pursuit gain; and (4) the saccade probability. The shaded area in the top three curves encompasses ±1 SEM, and the traces are averages over all 180 trials for this subject, aligned on the time of initiation of finger movement. Trials were excluded from the average after the time of target interception, when the target disappeared. The filled black circle in the bottom panel shows the average interception time (±1 SD), which is also indicated by the arrows in other panels. The horizontal line in the bottom panel denotes the average saccade probability in the 1 s interval preceding the onset of finger motion. The red lines show for comparison data obtained in the control experiment from the same subject (6) in which the target was only tracked visually. These data were averaged by aligning them on the times of interception onset for corresponding trials in the interception task.