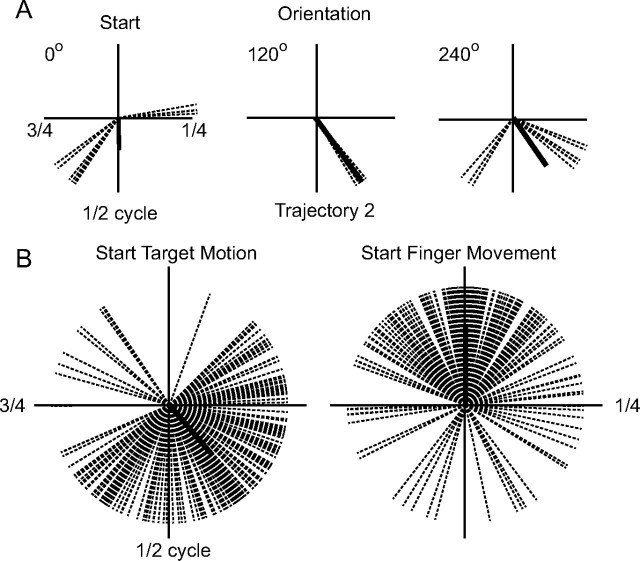
Figure 6.
Variations in the time of interception for individual trials. Each dashed line in the polar plots denotes the time in the periodic motion of the target at which finger movement was initiated in one trial (time progressing in a clockwise direction). The thick black line represents the circular average of the data; its length representing the consistency of the distribution. Results for all trials performed by the subject are depicted. A, Data for one subject (6) and three orientations (0, 120, and 240°) of path 2. B, All of the data from this subject, centered on the start of target motion (left) or on the average time of initiation of finger motion for each path and orientation.

