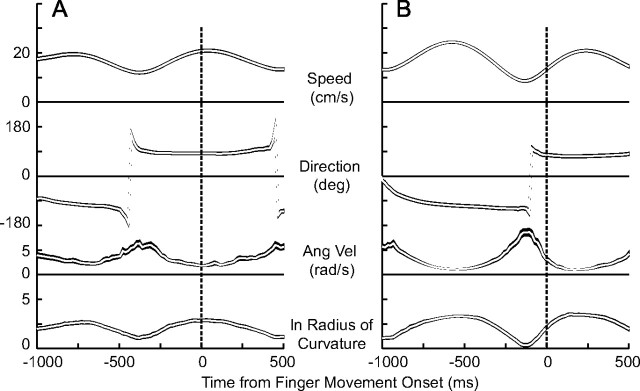
Figure 7.
Variations in target motion parameters around the time of initiation of the interception of the target. The traces from top to bottom show the average target speed, its direction of motion, angular velocity, and logarithm of the radius of curvature of the target. For direction, 0° is to the right, and 90° is down. The ln of the radius of curvature is shown because this parameter varies over a much larger range than do the other variables. The shaded areas for each trace encompass ±1 SEM. All trials from one subject were aligned on the onset of finger movement before averaging. A, Data from subject 1. B, Data from subject 4.

