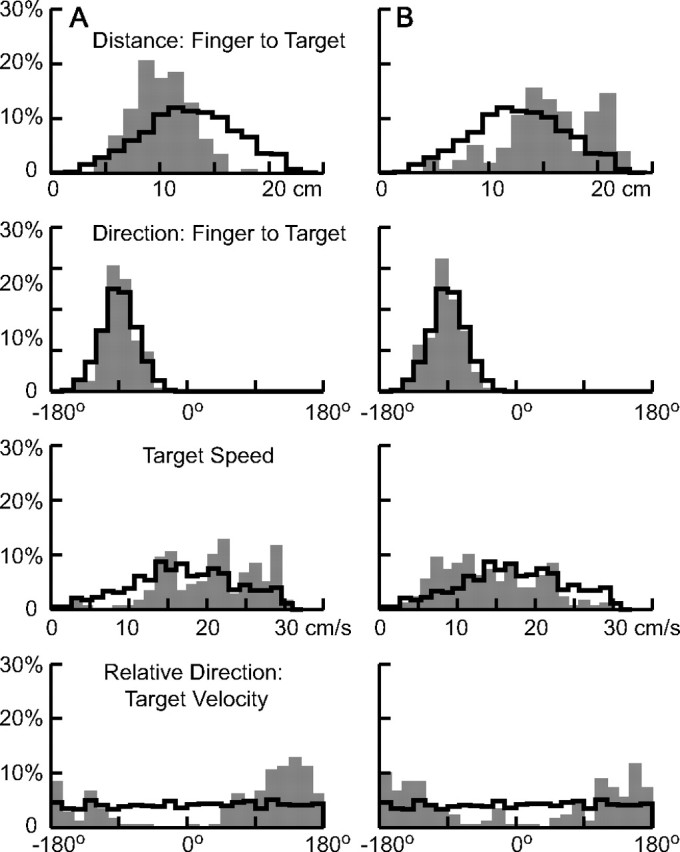
Figure 8.

Distribution of target parameters at the time of initiation of interception. The shaded histograms in the top two panels show the probability distribution of the distance of the target from the finger and the direction from the finger to the target (−90° is straight up). The thick black line shows, for comparison, the distribution of these values had the interception been initiated at random times throughout the cycle. The bottom two panels show the distributions in the speed of the target and the direction of its motion relative to the direction from the finger to the target (0° indicates the target is moving directly away from the finger; at 180°, it is moving toward the target). A, B, Results from two subjects (A, 6; B, 4; the same as shown in Fig. 7B). All trials from each subject were included in these plots.
