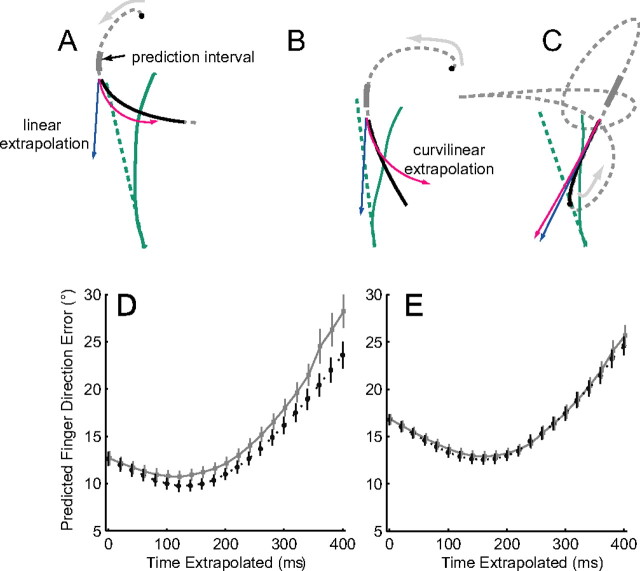
Figure 9.
Target motion prediction used to define initial direction of finger motion. A–C, The traces in the top row show three exemplary trials for one subject (3). The target trajectory up to the time of interception is shown in the dashed gray lines, with the arrows showing the direction of movement and the black circles indicating the target start position. Target motion was extrapolated using average motion during the prediction interval, indicated by the thick gray lines. The solid black line shows the target motion throughout the finger movement. The blue and red lines indicate the extrapolated target trajectory using the linear prediction (blue) or the curvilinear prediction (red). The finger motion is shown in green (solid trace), and the direction of the initial finger motion is indicated by the dashed green line. Note that, in some instances, curvilinear extrapolation was more consistent with the initial direction of finger motion (A), whereas in other instances, the results were more consistent with a linear extrapolation (B). The bottom row shows the error between the actual initial finger direction and the direction predicted by the extrapolating target motion for times ranging from 0 to 400 ms after the onset of interception. Errors are shown for curvilinear (black line) and linear (gray line) extrapolations (average ± 1 SEM). D, Data for subject 3. E, Data for all five subjects.

