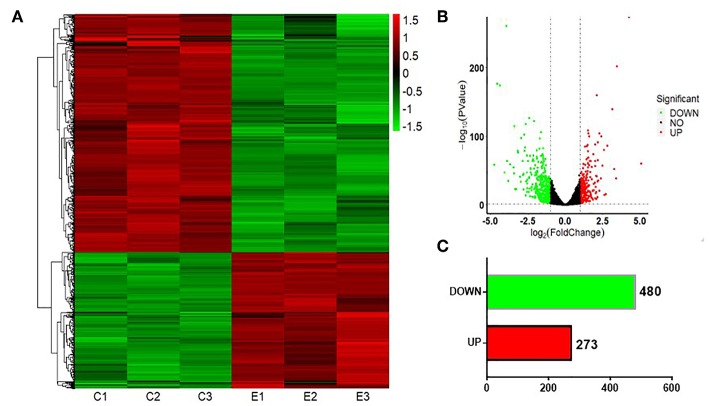
Figure 5.
Graphical representation of the 753 mRNAs differentially expressed between S30 cells and normal BEAS-2B cells. (A) Heatmap of the 753 differentially expressed genes (DEGs) between the CS-induced malignant transformed cells (S30) and normal BEAS-2B cells. The colors in the heatmap represent the normalized expression values, with low expression values being colored in green and high expression values in red. (B) Volcano plots were generated to visualize the distribution of DEGs between normal BEAS-2B and S30 cells. The top five most significantly dysregulated genes are marked. (C) Counts of genes upregulated or downregulated in S30 cells.

