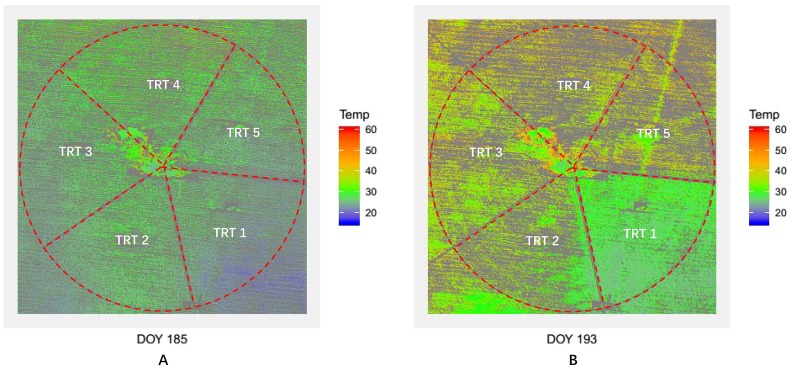
Figure 12.
Maps of maize canopy temperature (Tc) derived by the co-registration approach (red–green ratio index (RGRI)-Otsu). Panel (A) for Tc maps derived by using unmanned aerial vehicle (UAV) thermal and red–green–blue (RGB) imagery acquired on day of year (DOY) 185; (B) for Tc maps derived by using UAV thermal and RGB imagery acquired on DOY 193.

