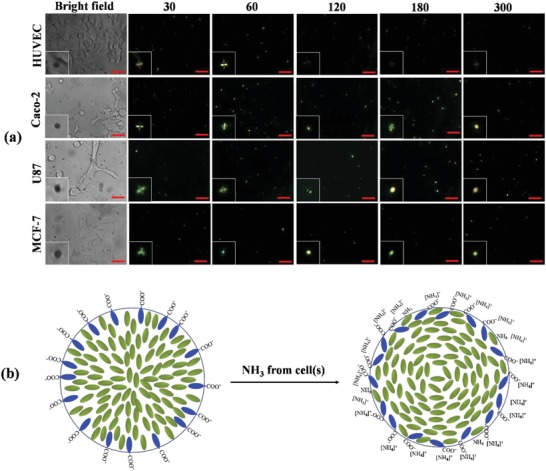
Figure 5.

a) POM images of P‐E7PBA droplets immobilized on cells as a function of time. The numerals represent time in s. The inset images are not to scale. The scale bars are 10 µm. b) Schematic representation of E7PBA configuration before and after the interaction of NH3 + NH4 + at the interface. The NH3 diffuses from the cell to the cellular microenvironment. With a dissociation constant (pKa) of 9.3, the NH3 + NH4 + content is 99% composed of NH4 + ions. NH4 + interacts with the COO−‐functionalized LCs, reducing the net charge density at the LC/aqueous interface, which results in the R‐B orientation change of the P‐E7PBA droplets.
