Figure 4.

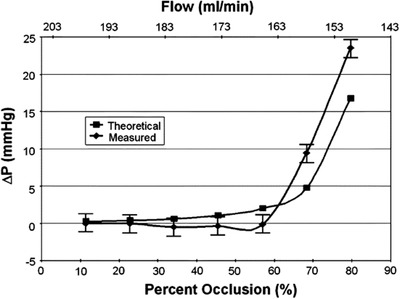
Graphical representation of flow rate and pressure changes caused by varying degrees of occlusion. Theoretical curve with a comparison to a measured curve by a BiCMOS. Reproduced with permission.73 Copyright 2006, IEEE.

Graphical representation of flow rate and pressure changes caused by varying degrees of occlusion. Theoretical curve with a comparison to a measured curve by a BiCMOS. Reproduced with permission.73 Copyright 2006, IEEE.