
Figure 5.
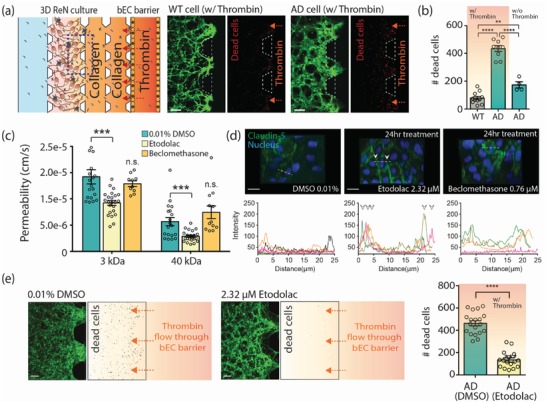
Demonstration of influx of neurotoxins through the impaired BBB and its effects on neural cell damage, and a possible application of drug evaluation for a BBB enhancer. a) Neural cell damage by thrombin inflow through the impaired bEC barrier. Cell death was assayed using ethidium homodimer‐1 after introducing thrombin into the bEC barrier MC at coculture day 3. Dead cells were shown in red. Scale bars: 200 µm. b) The number of dead cells (red) in the ROI (in 0.73 mm2) (n ≥ 9 for WT/AD with thrombin; n ≥ 4 for AD without thrombin, **p < 0.01, ****p < 0.0001). c) Permeability of the bEC barrier cocultured with AD cells with or without drug treatment (n ≥ 26 for 0.01 % DMSO and etodoalc, n > 5 for beclomethasone, ***p < 0.001, n.s., not significant). d) Comparison of tight junction protein expression in the bEC barrier of the AD model after drug treatment for 24 h. The junction protein expression of claudin‐5 was visualized by immunofluorescence staining with a claudin‐5 antibody and DAPI for cell nuclei. Graphs show the intensity profile of claudin‐5 at the cell junctions. Arrows indicate claudin‐5 expressions at the junctions of cells. Each colored line indicates the intensity profile of claudin‐5 expressed by randomly selected cells. Scale bars: 20 µm. e) Comparison of the amount of dead (damaged) WT/AD neural cells in the 3D ReN culture MC. Cell death was analyzed by counting dead cells (red) in ROI (in 0.73 mm2) (n ≥ 16, ****p < 0.0001). Scale bars: 100 µm. Data are mean ± S.E.M. Statistical analysis was by Student's t test.