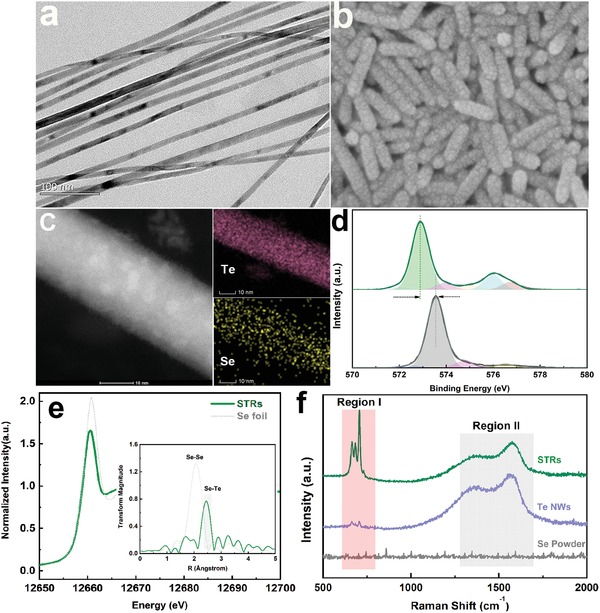
Figure 2.

Structure and composition characterizations for Te‐based materials. a) Scanning electron microscope (SEM) images for Te NWs. b) SEM images for as‐obtained STRs. c) Elemental mapping images of Se, Te, and O on surface of STRs. d) Comparison of high‐resolution Te 3d XPS spectra for Te NWs (gray line) and STRs products (green line). e) Se K‐edge XANES and corresponding EXAFS spectra (inset) of STRs and Se reference. f) Raman spectra of STRs, Te NWs, and Se powder, respectively.
