
Figure 3.
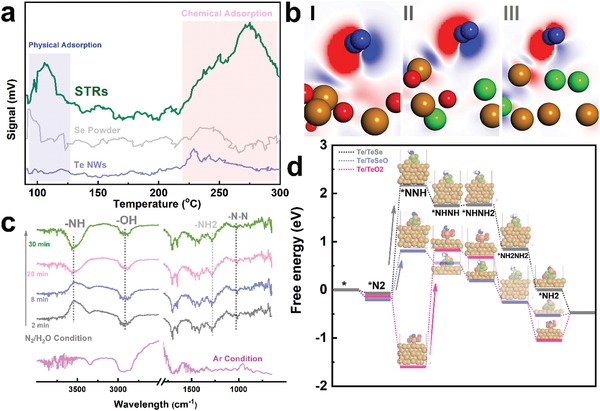
Catalytic N2‐to‐NH3 conversion analysis. a) Comparison of N2 adsorption on surface of different materials. Data from N2‐TPD profiles are shown for STRs (green), Te (blue), and Se (gray). b) Charge density difference of N2‐adsorbed TeO2 (I), TeSeO (II), and TeSeO (III). Red and blue isosurfaces, respectively, represent charge accumulation and depletion in space. c) In situ DRIFT spectra of STRs after treatment with N2/H2O at room temperature. d) Illustration of free energy diagram for Te‐containing samples. Te, O, Se, and H atoms are shown in gold, blue, and white, respectively.