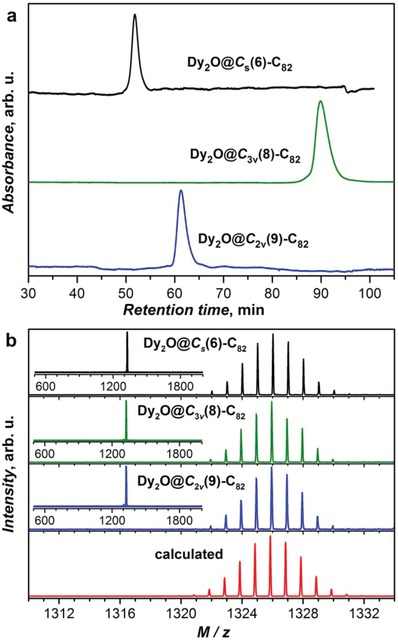
Figure 1.

a) HPLC chromatograms of isolated Dy2O@C s(6)‐C82, Dy2O@C 3v(8)‐C82, and Dy2O@C 2v(9)‐C82 obtained on a 10 mm × 250 mm Buckyprep column with λ = 310 nm, a flow rate of 4.0 mL min−1, and toluene as the mobile phase. b) The corresponding experimental and theoretical mass‐spectra and isotopic distributions of Dy2O@C82.
