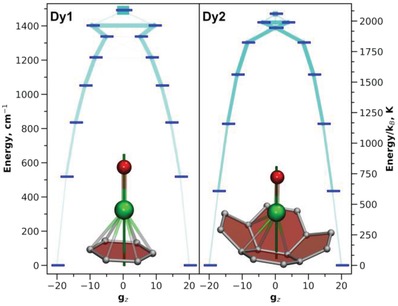
Figure 7.

Ab initio computed ligand‐field states (thick blue dashes) and transition probabilities between them (light blue lines; the thicker the line, the higher the transition probability) for two Dy ions in the lowest‐energy conformer of Dy2O@C82‐C s. Also shown are Dy‐cage coordination sites and quantization axes for each Dy ions (dark green lines). Dy, green; O, red; C, gray; Dy—C distances less than 2.60 Å are shown as bonds.
