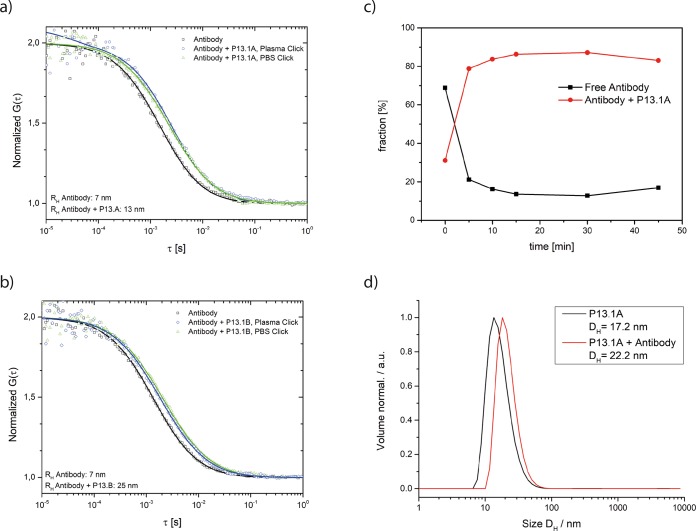
Figure 8.
(a) Antibody click with particle P13.1A in plasma. Normalized FCS autocorrelation curves of the antibody in plasma (black) and the antibody-particle-click after 1 h incubation in plasma (blue). For comparison the curve of the antibody-particle-click obtained after 1 h incubation in PBS and then diluted in plasma is also shown (green). (b) Antibody click with particle P13.1B in plasma. Normalized FCS autocorrelation curves of the antibody in plasma (black) and of the antibody-particle-click after 1 h incubation in plasma (blue). For comparison, the curve of the antibody-particle-click obtained after 1 h incubation in PBS and then diluted in plasma is also shown (green). (c) Fractions of the click-product (red) and the free antibody (black) vs the incubation time for the antibody-particle-mixture in plasma. (d) Antibody click with particle P13.1A in PBS. Size measurement of the particle (black) and the antibody-particle-click (red) after 1 h incubation in PBS.

