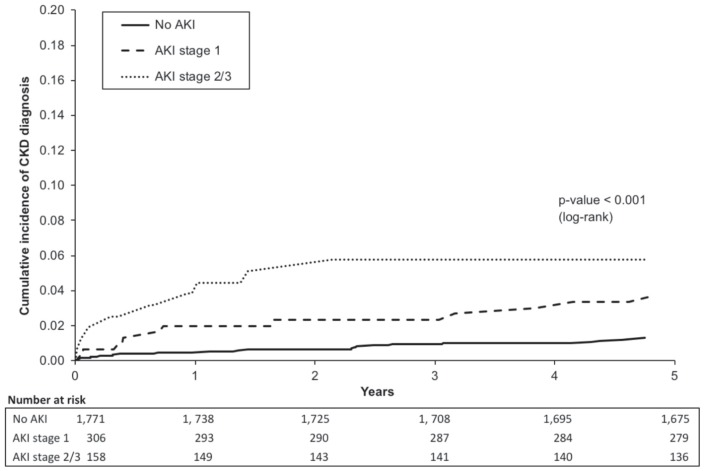
Figure 2.
Cumulative incidence curves for CKD stratified by AKI severity.
Note. The figure compares the incidence of a CKD diagnosis in patients with no AKI (solid line), stage 1 AKI (dashed line), and stage 2-3 AKI (dotted line). Time 0 is the date of hospital discharge. Log-rank test was used to compare groups. Incidence of a CKD diagnosis increases with the increasing severity of AKI. CKD = chronic kidney disease; AKI = acute kidney injury.

