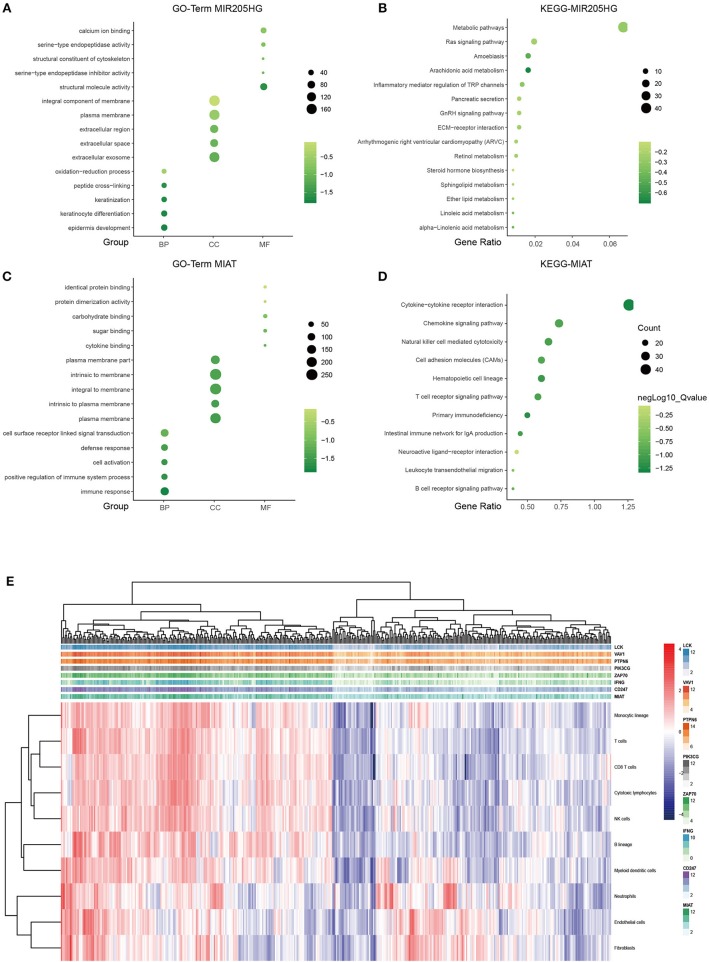
Figure 4.
LncRNA MIR205HG and MIAT function prediction. GO functional enrichment analysis of MIR205HG (A) and MIAT (C). X axis, GO term group; Y axis, GO terms. KEGG pathway enrichment analysis of MIR205HG (B) and MIAT (D). X axis, gene ratio; Y axis, KEGG pathway terms. light green, low enrichment; dark green, high enrichment. (E) Association between MIAT-mediated immune molecules expression and immune cell populations in melanoma. X axis: genes; Y axis: MIAT, MIAT-related immune molecules and immune cell. Red: high enrichment; blue: low enrichment. BP, biological process; CC, cellular component; MF, molecular function.

