Fig. 3.

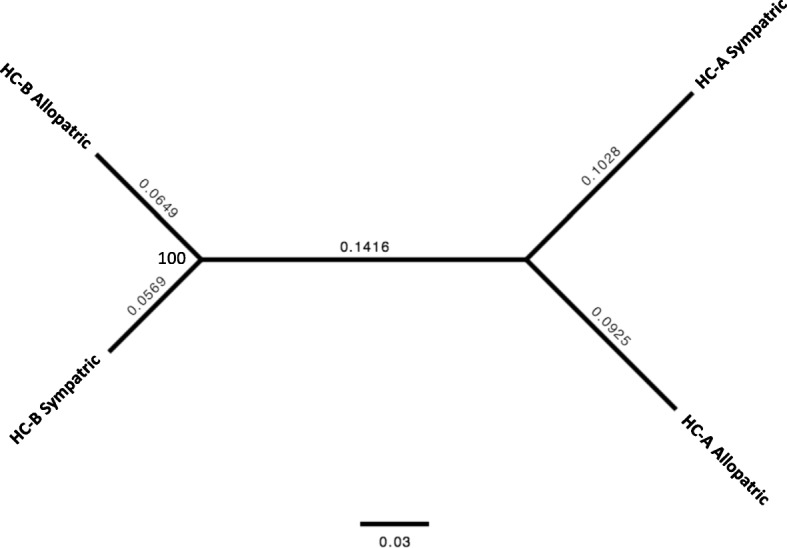
Dendrogram of the four populations of Heliopora libraries. The node values show ML-bootstrap percentage and the values above the branches are genetic distances (substitutions/site)

Dendrogram of the four populations of Heliopora libraries. The node values show ML-bootstrap percentage and the values above the branches are genetic distances (substitutions/site)