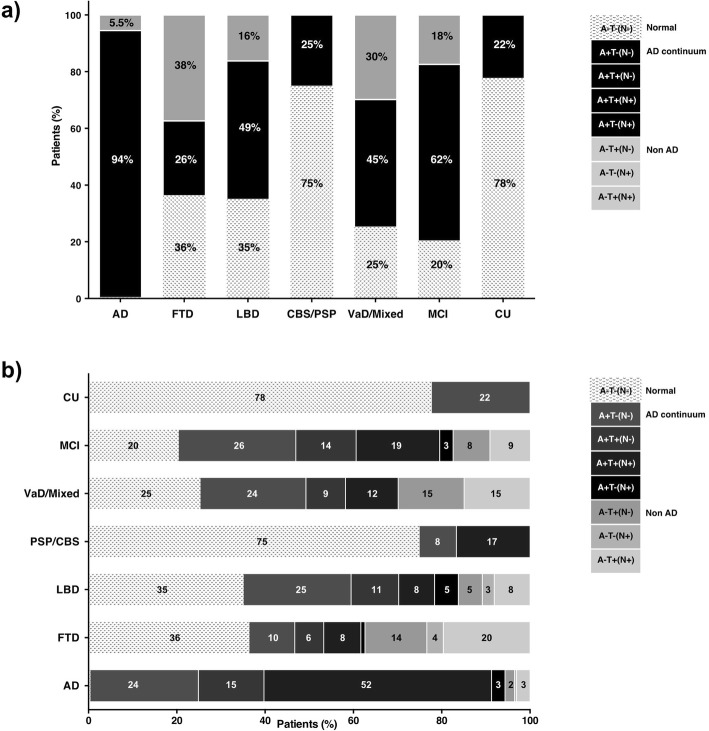
Fig. 1.
a Percentages of the three AT(N) biomarker profiles (AD-continuum, non-AD and normal) in each clinical syndrome. b Percentages of all the eight AT(N) biomarker profiles in each clinical syndrome. Percentages < 1% are not shown. AD Alzheimer’s disease (n = 229), FTD frontotemporal dementia (n = 107), LBD Lewy body dementia (37), PSP progressive supranuclear palsy (n = 3), CBS corticobasal syndrome (n = 9), VaD/mixed vascular/mixed dementia (n = 67), MCI mild cognitive impairment (n = 132), CU cognitively unimpaired (n = 9)

