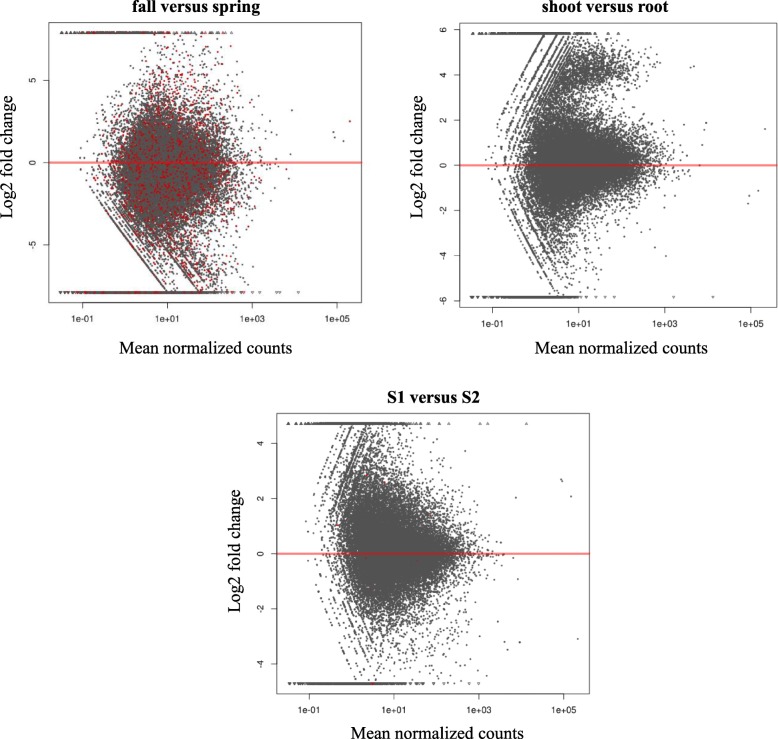
Fig. 4.
MA plot shows the log2 fold changes between two conditions for each factor (seasons, plant organs and sites). The log2 fold-change indicates the mean expression level for each gene (each dot represents a gene). The x axis is the normalized mean of all samples, the y axis the log2 fold change between the two conditions i.e. fall versus spring (seasons), shoot versus root (plant organs) and S1 versus S2 (sites). Red dots indicate genes with q value < 0.1

