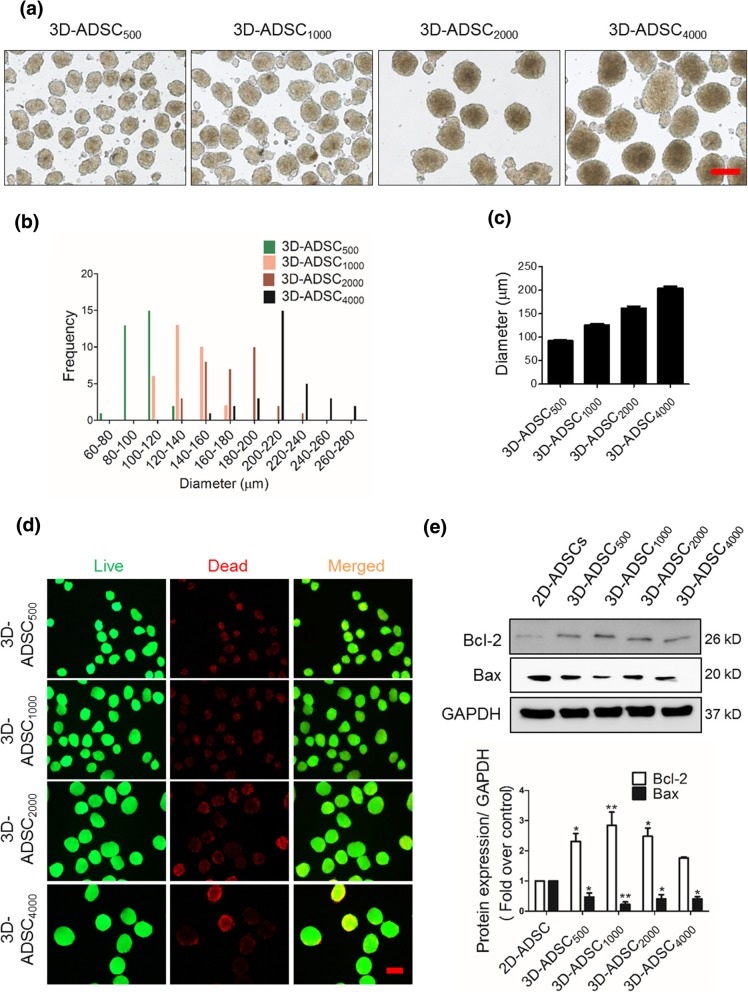
Fig. 1.
Formation of 3D spheroids of different sizes. a Morphology of 3D-ADSC, magnification: × 100, scale bar: 200 μm. b Size distribution. c Size of 3D-ADSC (n = 31) where values represent mean ± SEM. d Live/dead images for the determination of viability of differently-sized 3D-ADSC, magnification: × 100, scale bar: 200 μm. e Representative blot showing cell viability of 2D-ADSC and differently-sized 3D-ADSC and quantitative expressions of proteins measured using GelQuantNET software. The values represent mean ± SEM of three independent experiments. 3D-ADSC500, 500 ADSC per spheroid; 3D-ADSC1000, 1000 ADSC per spheroid; 3D-ADSC2000, 2000 ADSC per spheroid; 3D-ADSC4000, 4000 ADSC per spheroid. *p < 0.05 and **p < 0.01

