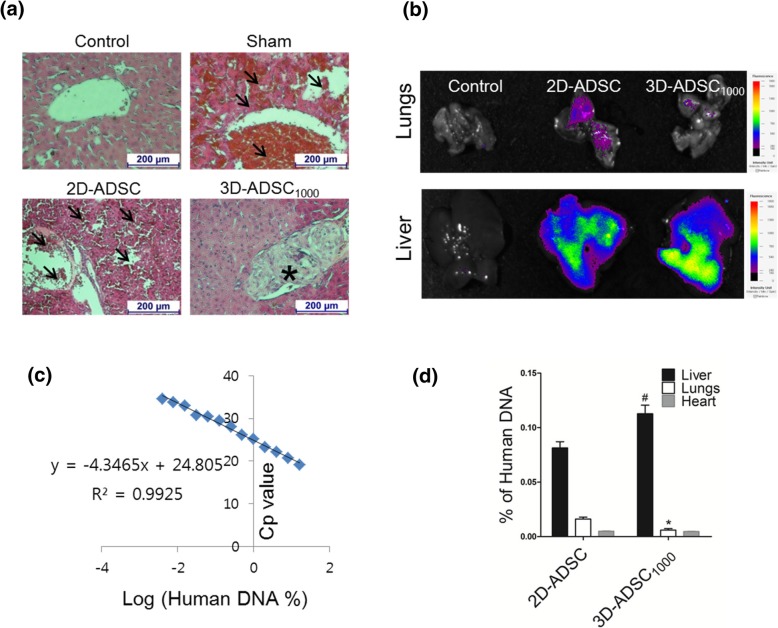
Fig. 3.
Fate of 2D- and 3D-cultured MSCs after transplantation via portal vein. a Histology of the liver 12 h after GalN/LPS administration; magnification: × 100, scale bar: 200 μm. Arrows indicate thrombosis, and the asterisk indicates localization of 3D-ADSC1000 in the liver. b Ex vivo imaging to observe the extrahepatic distribution of the transplanted cells after intraportal delivery. At 7 h of intraportal delivery of MSCs, ex vivo imaging was performed. Fluorescence was observed in the lungs of the 2D-ADSC-delivered group. However, negligible fluorescence was observed in the lungs of the 3D-ADSC1000-delivered group. In addition, significantly higher fluorescence intensity was observed in the liver of the 3D-ADSC1000-transplanted group compared to the 2D-ADSC-transplanted group. c Calibration curve for the determination of human DNA. d Percentage of human DNA observed in vital organs at 10 h of MSC transplantation (n = 3). The values represent mean ± SEM. *p < 0.05 vs 2D-ADSC in the lungs and #p < 0.05 vs 2D-ADSC in the liver

