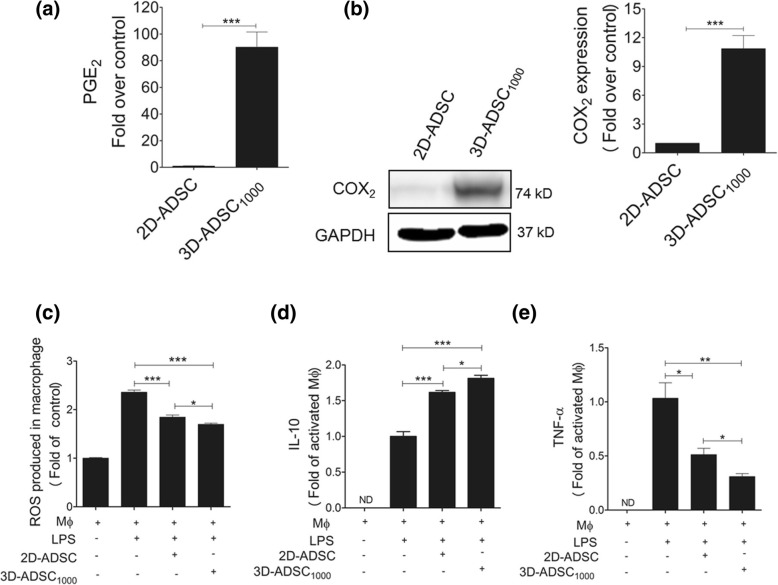
Fig. 5.
3D-ADSC1000 exerted enhanced immunomodulatory activity. a Basal levels of PGE2 secreted by 2D-ADSC and 3D-ADSC1000. Data represent mean ± SEM of three independent experiments. b Representative blot of COX2 expression in 2D-ADSC and 3D-ADSC1000 and quantitative estimation of COX2 expression using GelQuantNET software. Data represent mean ± SEM from three independent experiments. c Evaluation of ROS production in LPS-activated macrophages after co-culture with 2D-ADSC or 3D-ADSC1000 using fluorescence method. The graph represents mean ± SEM from three independent experiments (one-way ANOVA). d IL-10 (anti-inflammatory) secretions after co-culturing activated macrophages with 2D-ADSC or 3D-ADSC1000 for 10 h using ELISA. Data indicate mean ± SEM from three independent experiments (one-way ANOVA). e TNF-α secretion after co-culture of activated macrophage with 2D-ADSC or 3D-ADSC1000 for 10 h. Data indicate mean ± SEM from three independent experiments. *p < 0.05, **p < 0.01, and ***p < 0.001

