Fig. 3.
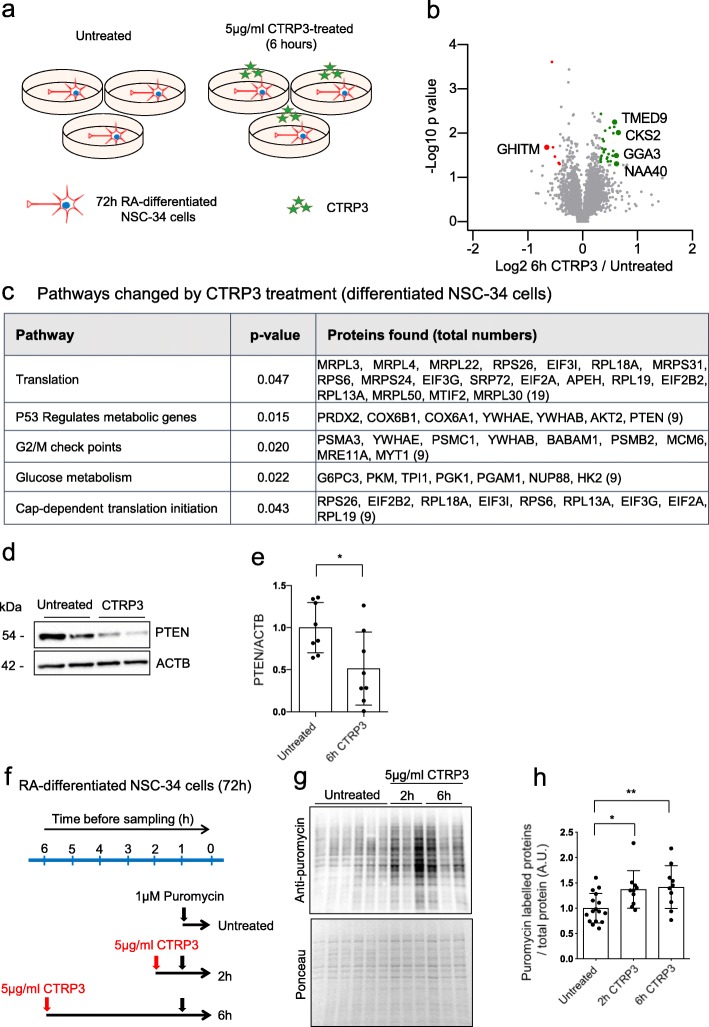
CTRP3 treatment stimulates protein synthesis in motor neuron-like NSC-34 cells. Downstream pathway analysis of CTRP3 in motor neuron-like NSC-34 cells. a Schematic drawing showing whole proteome analysis of differentiated NSC-34 cells. b Volcano plot of whole proteome analysis; plotted statistical significance (−log10, p-value) against fold change (log2, CTRP3 treated/untreated). Cells were treated with 5 μg/ml recombinant mouse CTRP3 (mCTRP3). Three independent samples were used for analysis. P-values were determined using an unpaired two-sided t-test (n = 3). Proteins with p < 0.05 are highlighted in green (upregulated)/ red (downregulated) and proteins with p < 0.05 and FC > 50% are additionally labelled with name. c Representative pathways changed by CTRP3 treatment. (proteins with p < 0.1 and pathways with p < 0.05, with g:Profiler). d Representative Western blots for PTEN and e quantification of PTEN levels in CTRP3 treated differentiated NSC-34 cells, Two-tailed unpaired student’s t-test was used to determine statistical signaficance, f Scheme of SUnSET assay. Differentiated NSC-34 cells were treated with mCTRP3 for 2 or 6 h. Cells were incubated with 1 μM puromycin for 1 h before analysis. g SUnSET assay shows that CTRP3 increases protein synthesis. h Dot plot bar graph summarizes SUnSET assay. SUnSET data were normalized to the total protein amount (ponceau). Each dot represents an independent experiment and the bar graph represents mean ± s.d. (n = 16/10/10). One way ANOVA with Fisher’s LSD test was used to determine statistical significance; * p < 0.05, ** p < 0.01

