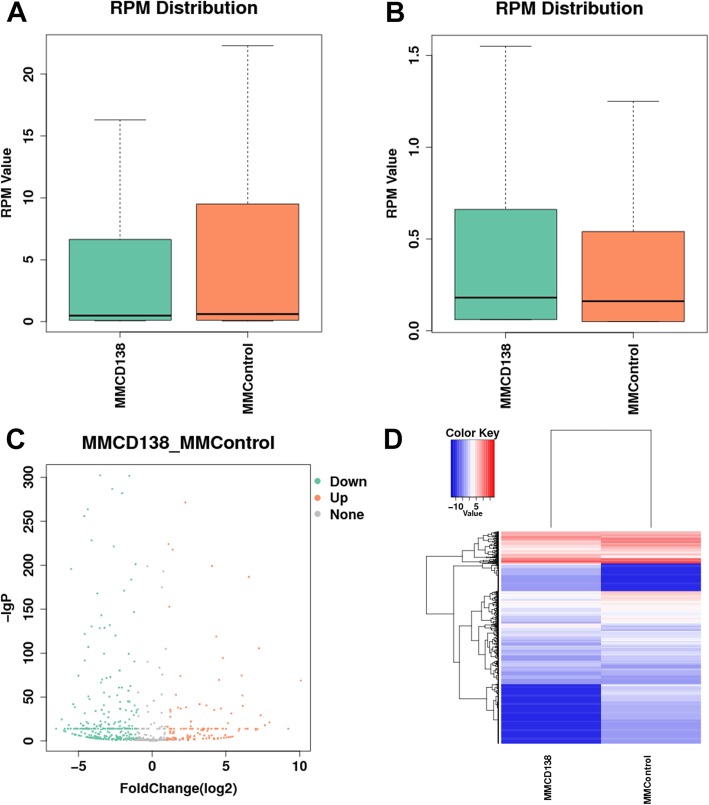
Fig. 5.
The expression profiling changes of the miRNA in MM compared with those in control. a Express the quantity distribution box of known miRNA; b Express the quantity distribution box of novel miRNA; c Volcano plot of differentially expressed miRNA; d Heat map of miRNAs showing the hierarchical clustering of changed miRNAs in the MM group vs the control. In the clustering analysis, upregulated genes and downregulated genes are colored in red and blue, respectively

