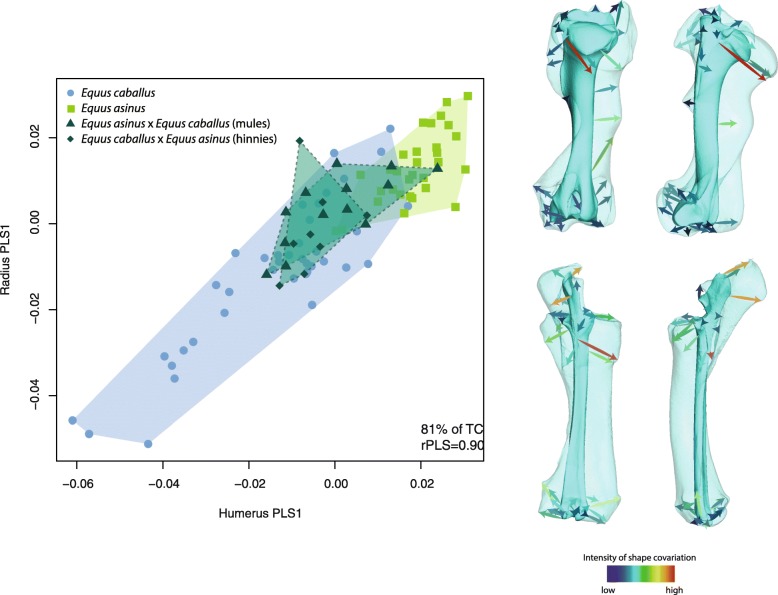
Fig. 5.
Scatter plot of the first PLS axis describing shape covariation between the humerus and radio-ulna, with visualizations of the associated shape changes (in transparent: extreme negative; in opaque: extreme positive). The color of the arrows corresponds to the intensity of shape deformation along the PLS axis (red: high intensity; blue: low intensity). TC: total covariation; rPLS: PLS correlation coefficient

