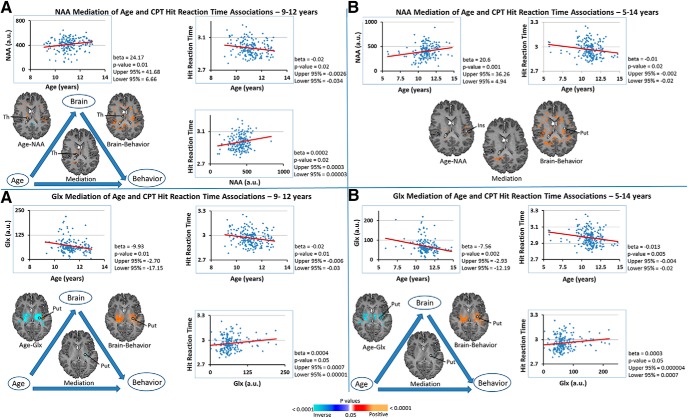
Figure 8.
NAA and Glx Mediation with Scatterplots shown here are illustrations of the mediating relationship of NAA or Glx with age and behavioral measures. Representative scatterplots of sampled brain regions are shown for NAA and Glx in children (A) 9–12 years and (B) 5–14 years, where beta is the degree of change in NAA or Glx per unit change in age. All associations were statistically significant, except for NAA mediation of the association with age with Hit Reaction Time in children ages 5–14. In each panel, the scatterplot on the top left shows the correlation of NAA or Glx with age; that on the top right shows the correlation of behavioral measure with age; and that in the bottom right shows the correlation of behavioral measure with NAA or Glx concentration. Effect size for A (top) was 1.82. Effect size for A (bottom) was −1.48 and for B (bottom) was −1.55. Ins, Insular cortex; Put, putamen; Th, thalamus.

